 Exponential Growth

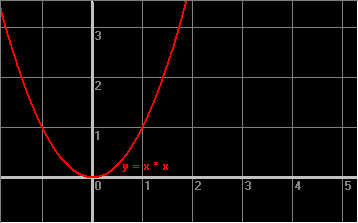
y = x * x
 Exponential Growth

We have a shorthand for expressions like 'x * x':
           2
x * x ==> x
Because the '2' is called an exponent, this type of function is said to be exponential.
With an exponential function, when you change x by some amount, y always changes at a rate that depends directly on the value you're changing from. The larger x is to start with, the more y will increase relative to the increase in x. This is the sort of growth seen in nearly 'mathematically perfect' systems, such as large populations of lifeforms. Exponential functions can grow to very large numbers very quickly.
Geometric proportion is always represented by an exponential function.
All the values that will ever appear on the 'x * x' side of our equation will be somewhere on this red line.