 Linear Growth

[y = x + 1] [y_=_x_*_x] [Phi_=_1.618...] [Phi_=_-0.618?]
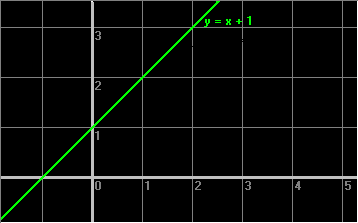
y = x + 1
 Linear Growth

[y = x + 1] [y_=_x_*_x] [Phi_=_1.618...] [Phi_=_-0.618?]
With a linear function, when you change x by some amount, y always changes by the same relative amount, no matter what the actual value of x is. The rate of change in a linear function doesn't depend on what value you change from. Even multiplying x by some constant number within a function still yields a straight line.
Arithmetic proportion is always represented by a linear function.
All the values that will ever appear on the 'x + 1' side of our equation will be somewhere on this green line.